Help
The EcID database (E. coli Interaction Database) provides a common framework for exploring the sizeable amount of protein interaction-related data available for Escherichia coli. EcID integrates information related with functional interactions extracted from the following sources: EcoCyc (metabolic pathways, protein complexes and regulatory information) KEGG (metabolic pathways) and MINT (protein interactions). It also contains information on protein complexes from the two published high throughput pull down experiments carried out in E. coli, and potential interactions directly extracted from the literature using the web-services associated to the iHOP text-mining system. Additionally, EcID incorporates results from two protein interaction prediction methods based on genomic information (Phylogenetic Profiles and Gene Neighborhoods) and three methods based on analysis of the potential co-evolution of the corresponding protein families (Mirror Tree, In Silico 2 Hybrid and Context Mirror). EcID associates to each predicted pair a confidence score that reflects the reliability of the functional interaction between those two proteins. In order to provide a global score to combine the predictive power of the prediction methods described above we have integrated in EcID a Bayesian-based classifier. This method includes the scores of five different prediction methods (Phylogenetic Profiles, Gene Neighborhood, Gene Fusion, Mirror Tree and In Silico 2 Hybrid), together with information on a number of simple sequence features. The classifier was trained to predict the type of protein functional associations contained in EcID (derived from regulation data, biochemical pathways, protein complexes and protein physical interactions). EcID searches
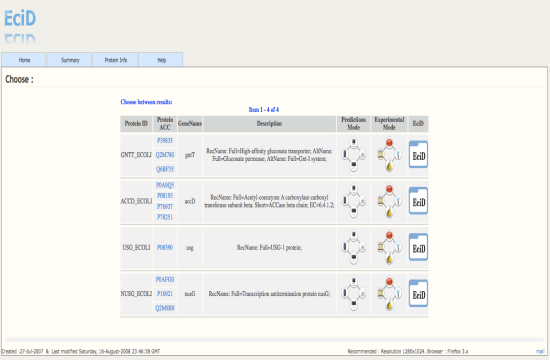
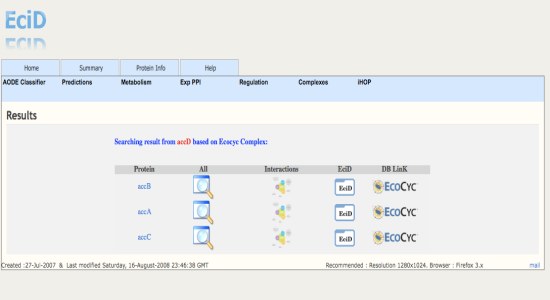
EcID allows free text queries on the UniProt entries stored in the database, including protein and gene names, UniProt IDs, accession numbers, and protein functional description. Alternatively, the user can perform a BLAST sequence search against the protein sequences stored in EcID, from which the desired entry can be selected. To get a more detailed information about the computational methods used, the external data contained in EcID or an example regarding the usage of Ecid, select the wished information below. EcID Modes
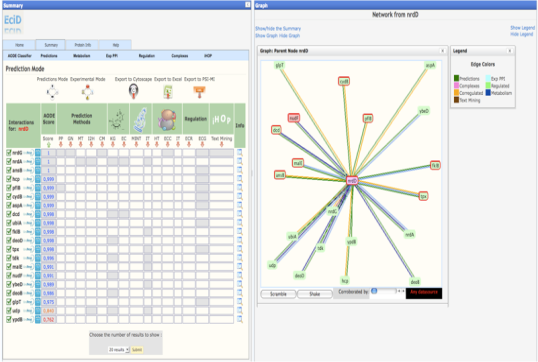
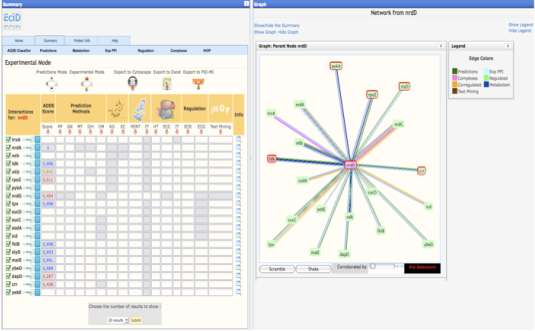
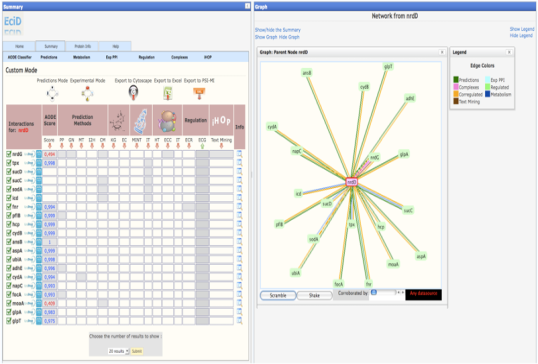
Once you have selected your protein, in the summary web page you will find 3 different modes to view the results. These results only differ in the way used to order the method/predictions. * Prediction Mode : In this mode, the interacting proteins are sorted by our statistical score (APPIA, see method descriptions). * Experimantal Mode : In this mode, the interacting proteins are sorted depending on the experimental method that defines this pair. MINT, IntAct and the complexes defined by EcoCyc are taking first into account to sort. Kegg and EcoCyc are taking secondly into account. Regulation, Corregulation and text mining are the third method to be sorted. And then HT experiments, the APPIA score and the predictions methods are taken into account. * Custom Mode : This mode is presented when the user select the desired method to sort from the experimental mode. In this case, the selected method is the first to take into account to sort. | |
Methods Description.
| This site contains the results of running 5 protein-protein interaction methods for all the possible pairs among E. coli and 227 procaryotic sequenced genomes. 4 methods are: in silico 2 hybrid (IH), mirror tree (MT), phylogenetic profile (PP) and gene context (GC), described below. These methods are reviewed in Valencia A and Pazos F, Curr. Opin. Str. Biol. 2002 12(3):368-73 and summarized in this picture. And the fifth one is Context Mirror. | |
In Silico 2 Hybrid System
| Pazos F & Valencia A. Proteins: Structure, Function and Genetics. 2002 47(2): 219-227. |
| The "in silico 2 hybrid system" to predict interaction partners from sequence information is based on the search for pairs of positions between two proteins that show a correlated mutational behaviour that could be due to space neighbouring between those two positions. The positions mutational behaviour is extracted from multiple sequence alignments. For each pair of multiple sequence alignments, interaction index is calculated as described in Pazos F & Valencia A. Proteins: Structure, Function and Genetics. 2002 47(2): 219-227 and each pair is ranked by the values of the predictions involving each of the putative interactors. The score for a putative interacting pair is calculated as the percentage of predicted pairs under it in the worst ranked interactor list. Interaction index values higher or equal to 99% are considered informative. |
Mirror Tree System
| Pazos F & Valencia A. Protein Eng. 2001 14(9): 609-14. |
| The mirror tree system is based on the observation in a number of closely studied cases, that interacting protein pairs co-evolve. In such cases,the corresponding phylogenetic trees of the interacting proteins show a greater degree of similarity (symmetry) than noninteracting proteins would be expected to show. Matrices containing the distances between all possible protein pairs were builded from multiple sequence alignments. These distances were calculated as the average value of the residue similarities taken from the McLachlan amino acid homology matrix (McLachlan, 1971). Then, the linear correlation coefficient (r) between the data of these two matrices was calculated according to the standard equation. Finally, each pair is ranked by the values of the predictions involving each of the putative interactors. The score for a putative interacting pair is calculated as the percentage of predicted pairs under it in the worst ranked interactor list. For this method, values >= 99% are considered informative. |
Phylogenetic Profile Method
| Gaasterland T, Ragan MA. Microb Comp Genomics 1998 3(4): 199-217. |
| This method is based on the pattern of the presence or absence of a given gene in a set of genomes,that is, determining in which organisms the gene is present and in which it is not. Similarity of phylogenetic profiles might then be interpreted as being indicative of the functional need for corresponding proteins to be simultaneously present in order to perform a given function together. However,although this similarity may suggest a related functional role,a direct physical interaction between the proteins is not necessarily implied. The main limitations of this approach lie in the fact that it can only be applied to complete genomes (as only then is it possible to rule out the absence of a given gene).Similarly,it cannot be used with the essential proteins that are common to most organisms. In these data set interactions are scored as 1-euclidean distance between vectors of presence/absence of both proteins in different prokaryotic organisms. Values of this score higher or equal to 0.8 are considered informative |
Gene Neighborhood Method
| Dandekar T, Snel B, Huynen M, Bork P. Trends Biochem Sci 1998 23(9): 324-8. |
| The organization of bacterial genomes into regions that tend to code for functionally related proteins,such as operons, is a well-known fact. This neighborhood relationship becomes even more relevant when it is conserved in different species. The adjacency of genes in various bacterial genomes has been used to predict functional relationships between the corresponding proteins. One of the main limitations of this method is that it is only directly applicable to bacteria,in which the genome order is a relevant property. Here data of presence of both sequence in DNA genome at a distance lower to 300 bp are shown. This data are scored by the number of prokaryotic organisms in which we could verify this condition. Numbers higher or equal to 2 are considered informative. |
Context Mirror
| Juan D, Pazos F, Valencia A. High-confidence prediction of global interactomes based on genome-wide coevolutionary networks Proc. Natl Acad. Sci, 2008 |
| This method introduces the new strategy of using the global network of protein evolutionary similarity for a better calibration of the evolutionary parallelism between two proteins. For this purpose, a protein ‘co-evolutionary profile' is defined as the vector containing the evolutionary correlations between a given protein tree and all the rest of the protein trees derived from sequences in the same organism. This co-evolutionary profile is a more robust and comparable representation of the evolution of a given protein (it involves hundreds of distances) and can be used to deploy a new level of evolutionary comparison. These co-evolutionary profiles are compared by calculating Pearson’s correlation coefficient for each pair. In this way, the method detects pairs of proteins for which high evolutionary similarities are supported by their similarities with the rest of proteins of the organism. This approach significantly improves the predictive performance of the tree similarity-based methods So different degrees of co-evolutionary specificity are obtained according to the number of proteins that might be influencing the co-evolution of the studied pair. This is done by calculating the partial correlation for each significant evolutionary similarity with respect to the remaining proteins in the organism. Levels of co-evolutionary specificity are defined according to the number of proteins that are considered to be co-evolving with each studied protein pair. The scores shown corresponds to Partial Correlation values for the 10th level of co-evolutionary specificity (as reported in Juan et al.) with p<=10-6. Partial correlation higher or equal to 0.6 are considered informative. |
AODE-based Predictor of Protein Interactions (APPIA)
| Beatriz García, David Juan, Iakes Ezkurdia, Eduardo Andrés León, Alfonso Valencia (Submitted) |
| "Averaged One-Dependence Estimators" (APPIA) classifier is used for the prediction of possible protein-protein interacting pairs integrating the main current computational techniques for the prediction of functional associations into a unified classifier system.
Input for the our bayes based classifier includes the scores from the following 5 prediction methods: Phylogenetic Profiles (PP), Gene
Context (GC), Gene Fusion (GF), MirrorTree (MT) and In silico Two-Hybrid (I2H). A protein-protein interaction reliability value for
predicted pairs is given for further interactome characterization. |
External Data Description
| The following classes of functional associations were imported from the external databases: Physical interactions
From low-throughput experiments, physical interactions were extracted from the manual expert annotations of the IntAct and MINT databases. Proteins forming part of complexes
For which we established two sub-classes: * High-quality complexes extracted from EcoCyc. This information is based on manual curation of the scientific literature and represents a set of well-known complexes. * Protein complexes extracted from the publications by Butland et al. and Arifuzzaman et al. These high throughput pull-down experiments provide extensive information of similar nature to the set of complexes extracted from EcoCyc, even if it is expected to be of lower quality. Regulator-regulated gene associations
We extracted the transcription regulatory data contained in EcoCyc and established functional links between each transcriptional regulator and its corresponding regulated genes. Set of co-regulated genes.
Based on the same type of information as the previous one, we established functional associations among those proteins that are coded by genes regulated by the same transcription factor. Proteins involved in the same biochemical pathway.
These functional associations are extracted from the KEGG (6) and EcoCyc (5) databases. We considered all the proteins assigned to the same pathway to be functionally associated by pairs, even if there is not direct physical interaction between them. Interactions directly extracted from the literature using text-mining techniques.
We include the protein name interactions obtained from iHOP (7) for E. coli proteins using the iHOP web service functionality (21). In this case protein interactions are defined as those in which the corresponding names appear in the same sentence of a PubMed abstract. |
Download
| Find in the following link all our data in a tab-separated file.
Click in the next icon to download the file
|
Usage

| Created :27-Jul-2007 & Last modified Sunday, 15-March-2010 23:44:21 GMT | Recommended : Resolution 1280x1024. Browser : Firefox 3.x |